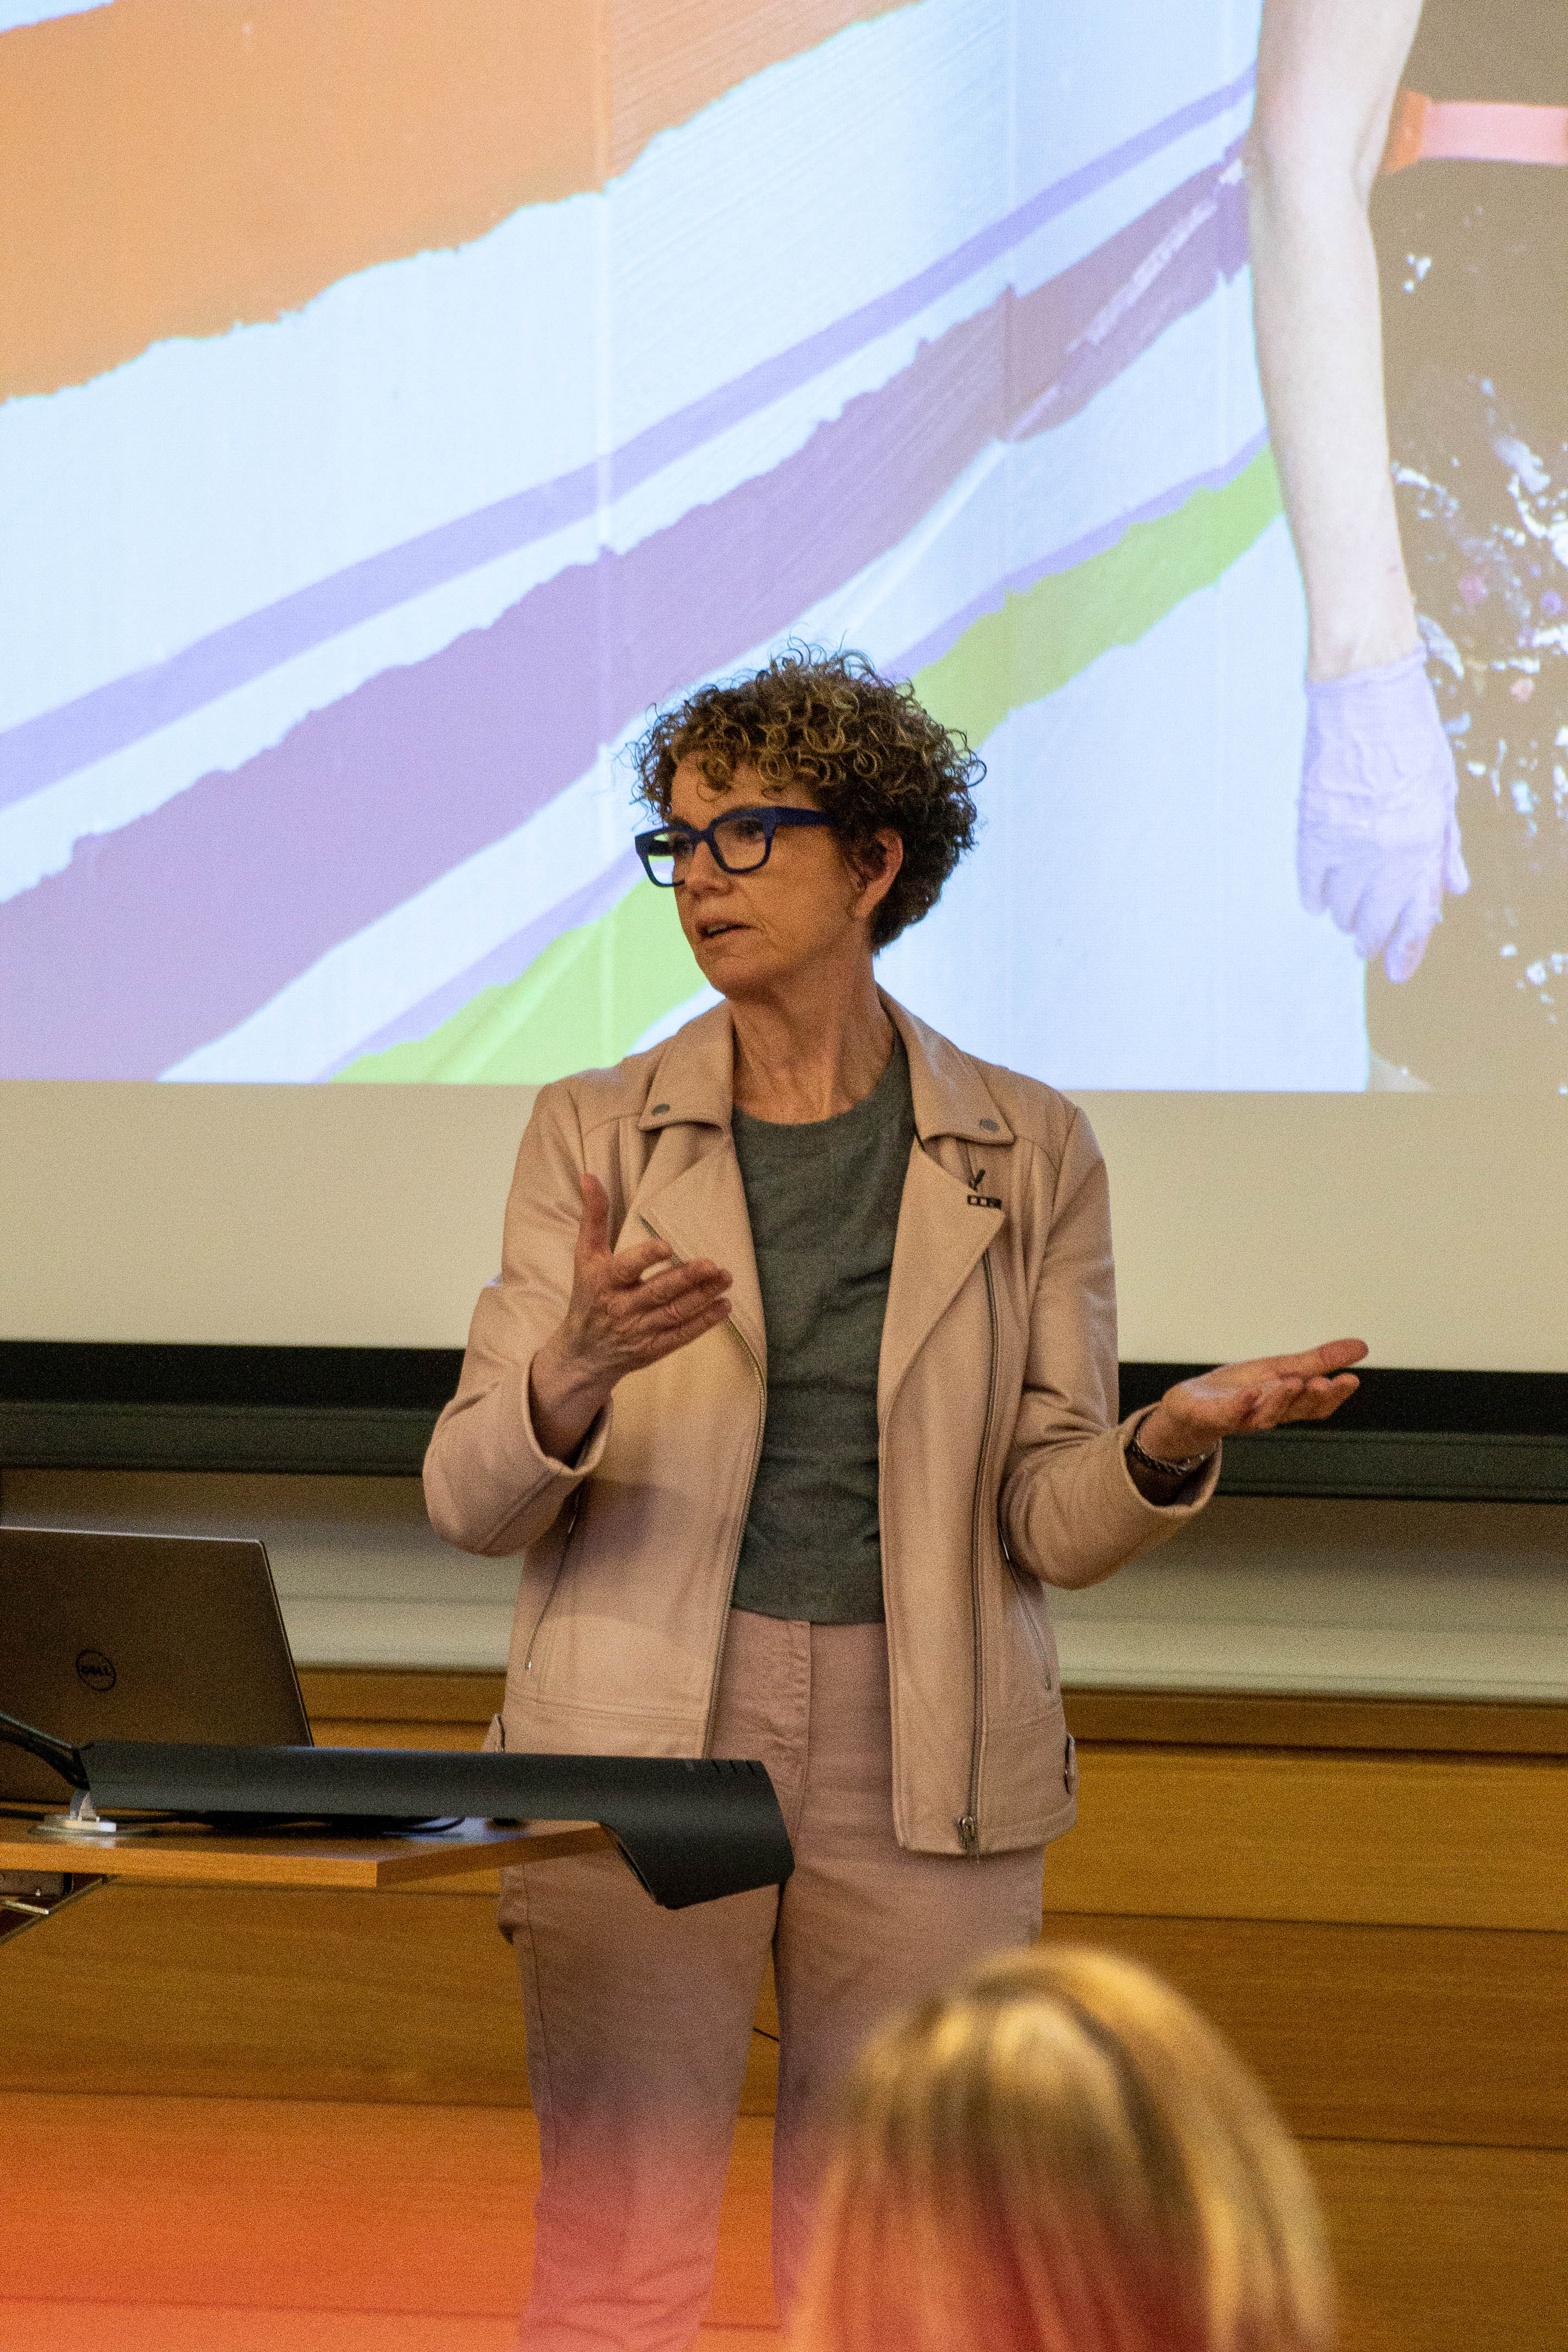
Laurie Frick is a data artist who gave a talk about how data can be better understood through art. Photo by Chris Crosby.
Data Artist Laurie Frick attended the University of Rhode Island on Wednesday, March 20 to lecture about the use of data and how it can be expressed through art.
The presentation, which was held at the Beaupre Center for Chemical and Forensic Sciences, was centered around how much data is out there about humans and how it can be seen and understood through art. In describing the relationship between data and art, Frick relied on small sentences that carried lots of emotion.
“It’s just so hard to see yourself, to know,” she said.
In such a vague title of data art, Frick showed a side of art that is uncommon and not the first thing that comes to mind when thinking of the subject. First-year student Emile Jones, who went to the event after seeing it on the URI Events page online, agreed with this sentiment.
“I definitely wasn’t expecting that kind of abstract art,” said Jones. “I thought it was going to be a lot more patterns in the natural world as opposed to patterns in yourself so that was interesting.”
During the presentation, Frick showed numerous examples of artwork that is derived from data she collected. In Austin, she painted a 12,000 square foot mural depicting a graph that showed the amount of tourists travelling to the city.
Frick began to think about data when pondering about how many times she has given it to people. This includes inserting cell phone numbers and emails when signing up for things, and how many times she has swiped her credit card. Frick made the audience laugh when mentioning Amazon and how they know how fast she reads.
The amount of data that’s potentially out there got Jones thinking of the potential available data applicable to students.
“It would also be interesting if there was a way to pinpoint how many times you swiped into your room,” said Jones. “Just seeing that over time and how that shows up or even looking at when two roommates swiping into the rooms or even the dining halls.”
Frick’s first breakthrough into the realm came when she was studying sleep patterns. She kept track of how much she slept during the night, and then over time she graphed the results.
The presenter took it one step further when she began wearing an EGT monitor to study her sleep patterns. She originally thought she was a good sleeper, but when examining and illustrating the data Frick discovered that her sleep could be more improved. Her husband had the opposite effect, and thus began Frick’s obsession with data.
While lecturing to the audience of 40 people, Frick talked about how she created a collage that tracked walking trends through the use of
“I’d be interested over the summer in seeing how I spend my time and how that just looks visually,” said Jones.
Overall, Frick wants people to appreciate the data that’s out there and cited just how important it is in society.
“Data is irresistibly powerful to human understanding,” she said.